@[email protected] to [email protected] • edit-210 months agoWhat is happening in Norway, and how do we spread it?lemmy.worldimagemessage-square149fedilinkarrow-up1785arrow-down110file-text
arrow-up1775arrow-down1imageWhat is happening in Norway, and how do we spread it?lemmy.world@[email protected] to [email protected] • edit-210 months agomessage-square149fedilinkfile-text
minus-square@[email protected]linkfedilinkEnglish1•edit-210 months agoHow do you make the graph? What type of graph is it? So I can use it for browser marketshare and search engine marketshare.
minus-square@[email protected]OPlinkfedilink2•10 months agoYou can download the .csv data from the website. Then make a stacked area chart in something like Excel/Google Sheets/Libreoffice Calc.


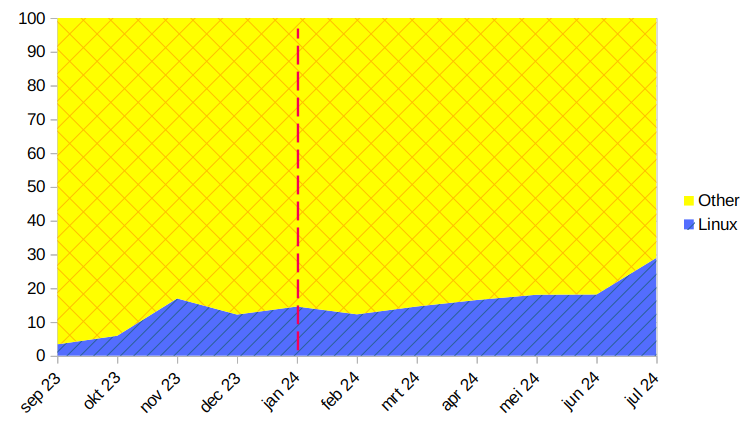
How do you make the graph? What type of graph is it?
So I can use it for browser marketshare and search engine marketshare.
You can download the .csv data from the website. Then make a stacked area chart in something like Excel/Google Sheets/Libreoffice Calc.